WordPress Tutorials
Setting Up WordPress Heatmaps on Your Website (Step-by-Step Guide)
Jun
Last Updated on June 29, 2024 by Jérôme Kerviel
WordPress heatmaps is for Understanding user behavior through in-depth analytics can significantly enhance your content strategy. However, interpreting numbers and metrics can be overwhelming.
Heatmaps provide an intuitive way to track and analyze activity on your site. These tools offer a visual representation of how users interact with your content, highlighting the areas that attract the most attention and engagement. By visually mapping user behavior, heatmaps allow you to see which parts of your site are most effective and which areas need improvement.
With heatmaps, you can:
- Identify Hotspots: Discover which sections of your pages receive the most clicks, taps, and scrolling activity. This helps you understand what captures your audience’s interest and keeps them engaged.
- Detect Problem Areas: Spot areas where users might be experiencing difficulties, such as confusing navigation or unresponsive elements. By identifying these issues, you can make necessary adjustments to enhance the user experience.
- Optimize Content Placement: Use the insights from WordPress heatmaps to strategically place important content, call-to-action buttons, and advertisements where they are most likely to be noticed and acted upon.
- Enhance User Engagement: By understanding how users interact with your site, you can tailor your content and design to better meet their needs, leading to increased engagement and satisfaction.
- Improve Conversion Rates: WordPress Heatmaps can help you identify and fix obstacles in your conversion funnels, ensuring a smoother path for users to complete desired actions such as signing up for a newsletter or making a purchase.
In this article, we’ll explore the benefits of WordPress heatmaps in greater detail and demonstrate how to set them up using a plugin. Whether you’re a seasoned web developer or a beginner, this guide will provide you with the knowledge and tools to effectively implement heatmaps on your WordPress site.
Let’s dive in and discover how heatmaps can transform your approach to website analytics!
What WordPress Heatmaps Are (and Why They’re So Useful)
A heatmap is a visual representation of data that uses colors to illustrate the level of interaction across different areas of your site. In a heatmap, warmer colors indicate higher engagement, while cooler colors represent less activity. This visual format makes it easy to identify which parts of your site are drawing the most user attention.
Heatmaps are incredibly useful tools for identifying design flaws or other issues that might be affecting your site’s User Experience (UX). Here’s how you might use a heatmap to improve your site:
- Evaluate Calls to Action (CTAs): By analyzing heatmap data, you can see if your CTAs are attracting enough attention compared to other elements on your pages. If they aren’t, you can take steps to make your CTAs more compelling and noticeable.
- Assess Navigation Effectiveness: Ideally, your navigation menu should always be a ‘hot’ area on the heatmap. If it’s not, this might indicate that users are having trouble finding or using your navigation, suggesting it needs improvement.
The real value of heatmaps lies in their ability to uncover specific design or navigation issues that might not be obvious through other forms of analytics.
There are two main types of heatmaps: click heatmaps and scroll heatmaps.
- Click Heatmaps: These are the most popular type, providing precise information about where users are clicking on your site. This can help you understand which elements are most interesting or useful to your visitors.
- Scroll Heatmaps: These give a broader view of your site’s performance by showing which areas capture readers’ attention as they scroll down the page. This can be particularly useful for understanding how effectively your content engages users throughout their visit.
In this tutorial, we’ll focus on setting up a click heatmap tool for WordPress. However, if you’re interested in scroll maps, tools like CrazyEgg offer robust alternatives for analyzing scrolling behavior.
Let’s dive into the practical steps for implementing a click heatmap on your WordPress site! 🧐
How to set up WordPress heatmaps (2 steps)
Now, let’s look at how to set up WordPress heatmaps, using the Aurora Heatmap plugin:
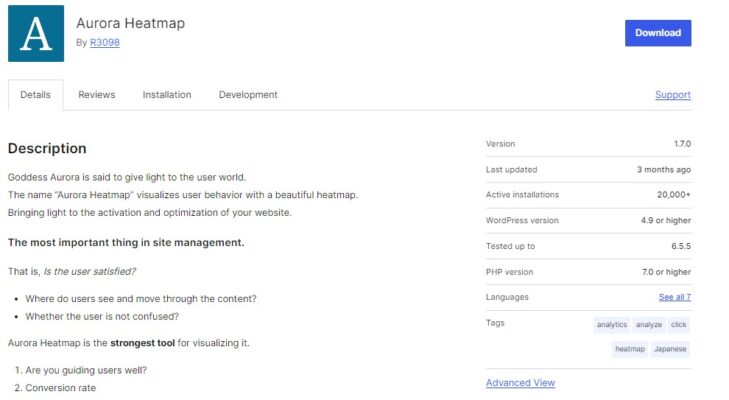
This tool is very easy to set up. Plus, unlike other similar plugins, you won’t need to create an account on a third-party heatmap service.
Also, the plugin is free. So, you can go ahead and install it on your website.
💡 Note: Aurora Heatmap can be used with WP Rocket, W3 Total Cache, and WP Super Cache. If it causes compatibility issues with your caching plugin, you’ll need to turn off JavaScript-related optimization or exclude jQuery and Aurora Heatmap measurement script (reporter.js) from optimization. You can find more information about this on this page.
- Step 1: Configure your heatmap
- Step 2: View your WordPress heatmaps
Step 1: Configure your heatmap
Once you’ve installed and activated the plugin, navigate to Settings > Aurora Heatmap in your WordPress dashboard:
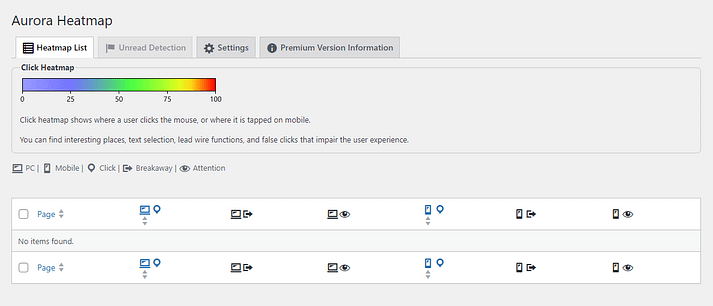
As you might notice, the Heatmap List tab doesn’t contain any data yet. It might take a while for the plugin to collect enough data to display a map, depending on your traffic.
In the meantime, you can configure some settings for your heatmap. To do this, navigate to the Settings tab:
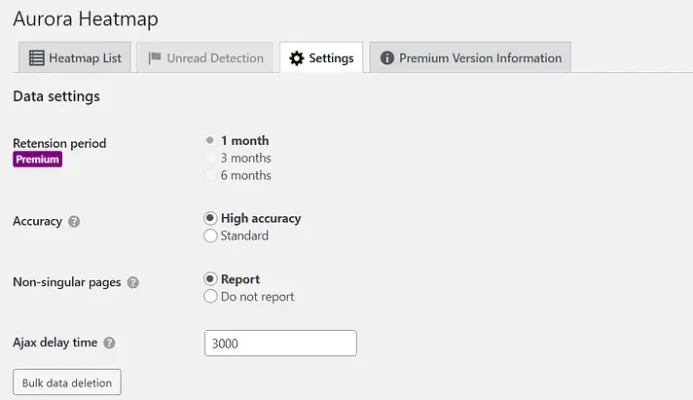
In the Data settings section, you can choose whether to include non-singular pages in the report. In the Ajax delay time field, you can set the time in milliseconds before the plugin starts logging activity.
If you scroll down to Display settings, you can select the number of drawing points. This is the amount of data included in the map:
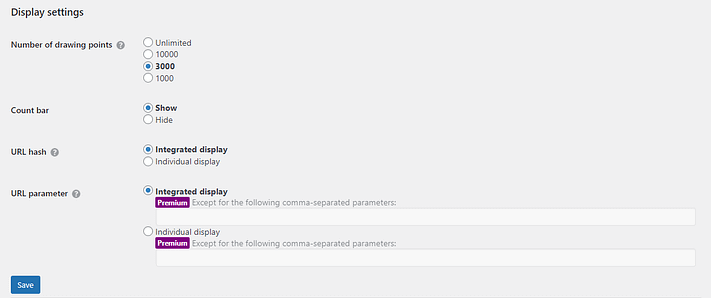
You also have the option to disable the count bar, and choose whether to count anchor links as separate pages. Remember to hit Save once you’ve selected your preferences.
If you opt for the premium plugin, you’ll get access to additional features, including weekly email reports.
Step 2: View your WordPress heatmaps
If you have a high-traffic website, you should be able to view your first WordPress heatmap within minutes of installing the plugin. If your site doesn’t yet get a lot of visits, you might need to wait a few hours until the first heatmap shows up.
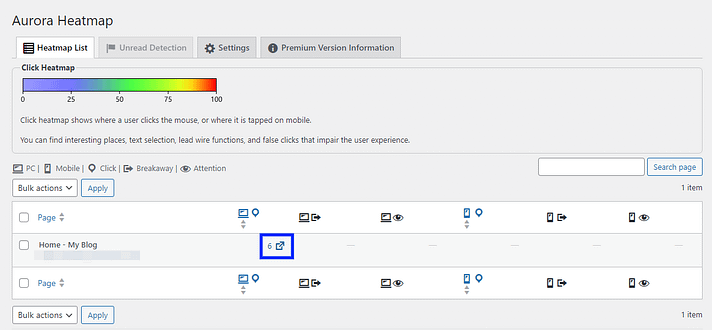
You need to navigate back to the Heatmap List tab to check the available heatmaps.
With the free version, you get two views for each WordPress heatmap: desktop clicks and mobile clicks. Hover over the number of clicks next to the page you want to check, and select the arrow icon to launch the heatmap:
In a new window, you’ll see a heatmap of your page. The colored blobs show you where users are clicking. In the sidebar, you’ll see the number of clicks:
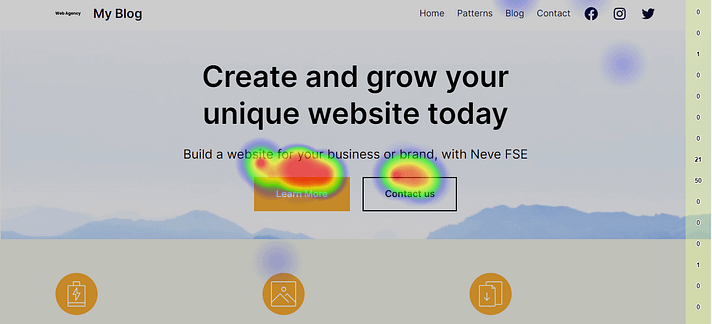
At the moment, you might only see blue spots on the page. However, as you get more traffic and the plugin collects more data, you’ll see a range of colors, including green, yellow, and red. Any element that gets over 75 clicks will have a warmer color.
The Conclusion
Heatmaps are a powerful visualization tool that provides clear insights into your users’ behavior. By using WordPress heatmaps, you can see which links and elements on your pages are getting the most clicks and which ones are being ignored. This valuable information allows you to make informed decisions to improve your site’s design and enhance the overall user experience.
Setting up heatmaps on your WordPress site is both easy and cost-effective. Using the Aurora WordPress Heatmap plugin, you can start monitoring user activity without any expense. This plugin enables you to customize WordPress heatmap settings, such as the amount of data included in the map, allowing you to focus on the specific areas you’re interested in.